Page 1 of 1
How to display emission zones in xMap2?
Posted: Thu May 20, 2021 9:35 am
by Lauterfeld
Hi,
Our users are missing the visualization of emission zones in xMap2. Worked fine in xMap1. How can we achieve the visualization of these zones?
Regards,
Volker
Re: How to display emission zones in xMap2?
Posted: Thu May 20, 2021 10:03 am
by Bernd Welter
Hello Volker,
copy the two attached files in your
/conf/profiles folder and use the "storedProfile=emissionzones".
If you want to play with the ALPHA blendings you can update these keys:
[config.background.alphablending]
; Green Zone, green
29=72
; Green Zone, yellow
30=72
; Green Zone, red
31=72
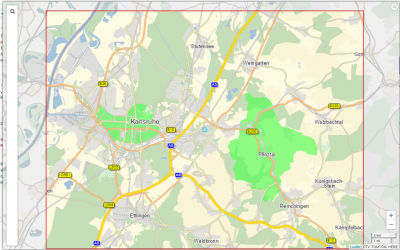
Result:

- based on alpha blending = 36
Here's the sample request:
Code: Select all
{
  "storedProfile" : "emissionzones",
  "mapSection": {
    "$type": "MapSectionByCenter",
    "centerCoordinate": {
      "x": 8.4746598928 ,
      "y": 49.004840798
    },
    "zoom": 10
  },
  "imageOptions": {
    "width": 800,
    "height": 600
  }
}
#greenzones #emissionzones
Re: How to display emission zones in xMap2?
Posted: Fri Oct 28, 2022 1:08 pm
by Bernd Welter
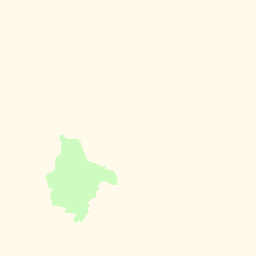
I've been asked whether it is possible to request a layer that only contains the greenzones.
Here we are -
OnPremise only!
Copy both files into your local /xserver.../conf/profiles and
request this example

- produced by the sample above
- emissionzonesNotVisible.png (1.6 KiB) Viewed 47726 times
Re: How to display emission zones in xMap2?
Posted: Tue Aug 22, 2023 10:02 am
by Bernd Welter
by the way:
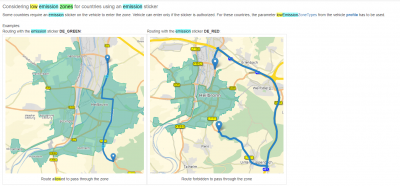
As mentioned in the
xServer 2.30 release announcement we will offer a new technical approach to visualize Low Emission Zones through xMap2...
